

A Former FDA Digital Health Staffer Graphs the FDA's MDUFA Performance Report Data
Love data made digestible? Check out this incredible report on the FDA’s medical device review performance metrics compiled by Brendan O'Leary.

This bonus issue is available to all subscribers. If you’re not already a subscriber, you can sign up here.
This issue contains content under a Creative Commons license. See our disclaimer and attribution statement at the bottom of this issue for more information.
If you enjoy analyzing industry data, you may be interested in exploring a detailed report on the FDA's medical device review performance metrics. The report was compiled by Brendan O'Leary, a former FDA Digital Health staffer who served as Deputy Director of the Digital Health Center of Excellence and as its Acting Director in 2022.
O’Leary’s analysis pulls out the interesting themes that are typically buried in massive MDUFA reports with some wonderful data visualizations showing device program metrics over time and across review groups.
Background and summary
The FDA publishes extensive quarterly and annual reports containing thousands of performance metrics in a series of tables. But, as you might know if you’ve seen these these reports yourself, they’re often extremely lengthy and challenging to analyze due to their format. O'Leary used his own software to scrap extract this data, making it available in more accessible formats such as spreadsheets and a data package for the R programming language (links to all of which you find in his report).
MDUFA, under which the FDA has been authorized to collect user fees since 2003, is the data source for his analysis. Its fees support regulatory activities related to medical devices, and the commitments associated with these fees have led to the publication of detailed performance metrics by the FDA. O’Leary extracts and groups the metrics contained in this data by fiscal year into "receipt cohorts" and "decision cohorts," with the former grouping submissions based on the year they were received and the latter based on the year a decision was made.
(O’Leary discusses the difficulties in interpreting these complex performance metrics, especially for open receipt cohorts. He favors looking at recently closed decision cohorts for a more accurate picture of performance.)
The report also digs into the impact of the Public Health Emergency (PHE) due to COVID-19 on the FDA’s work. He notes that this emergency had a significant influence on the data, particularly for the Office of Health Technology 7 (OHT7), the FDA’s diagnostics office, which was hit hard during the pandemic and whose performance metrics were absolutely decimated before returning to something more like normal.
He also notes that FDA reorganizations have affected data continuity, requiring careful consideration when aligning data across different MDUFA periods.
510(k) data visualizations
To us, the most interesting part of this report is its focus on the quintiles of FDA Days, Industry Days, and Total Days for various 510(k) performance metrics contained in the MDUFA data — an unusual but enlightening choice for summary statistics. O’Leary presents some wonderful data visualizations to provide a more comprehensive and digestible presentation of the tabular data found in the dense MDUFA reports, two of which we’ve excerpted below.
(Use the caption links to open them full-sized in a new window.)
Submission volume
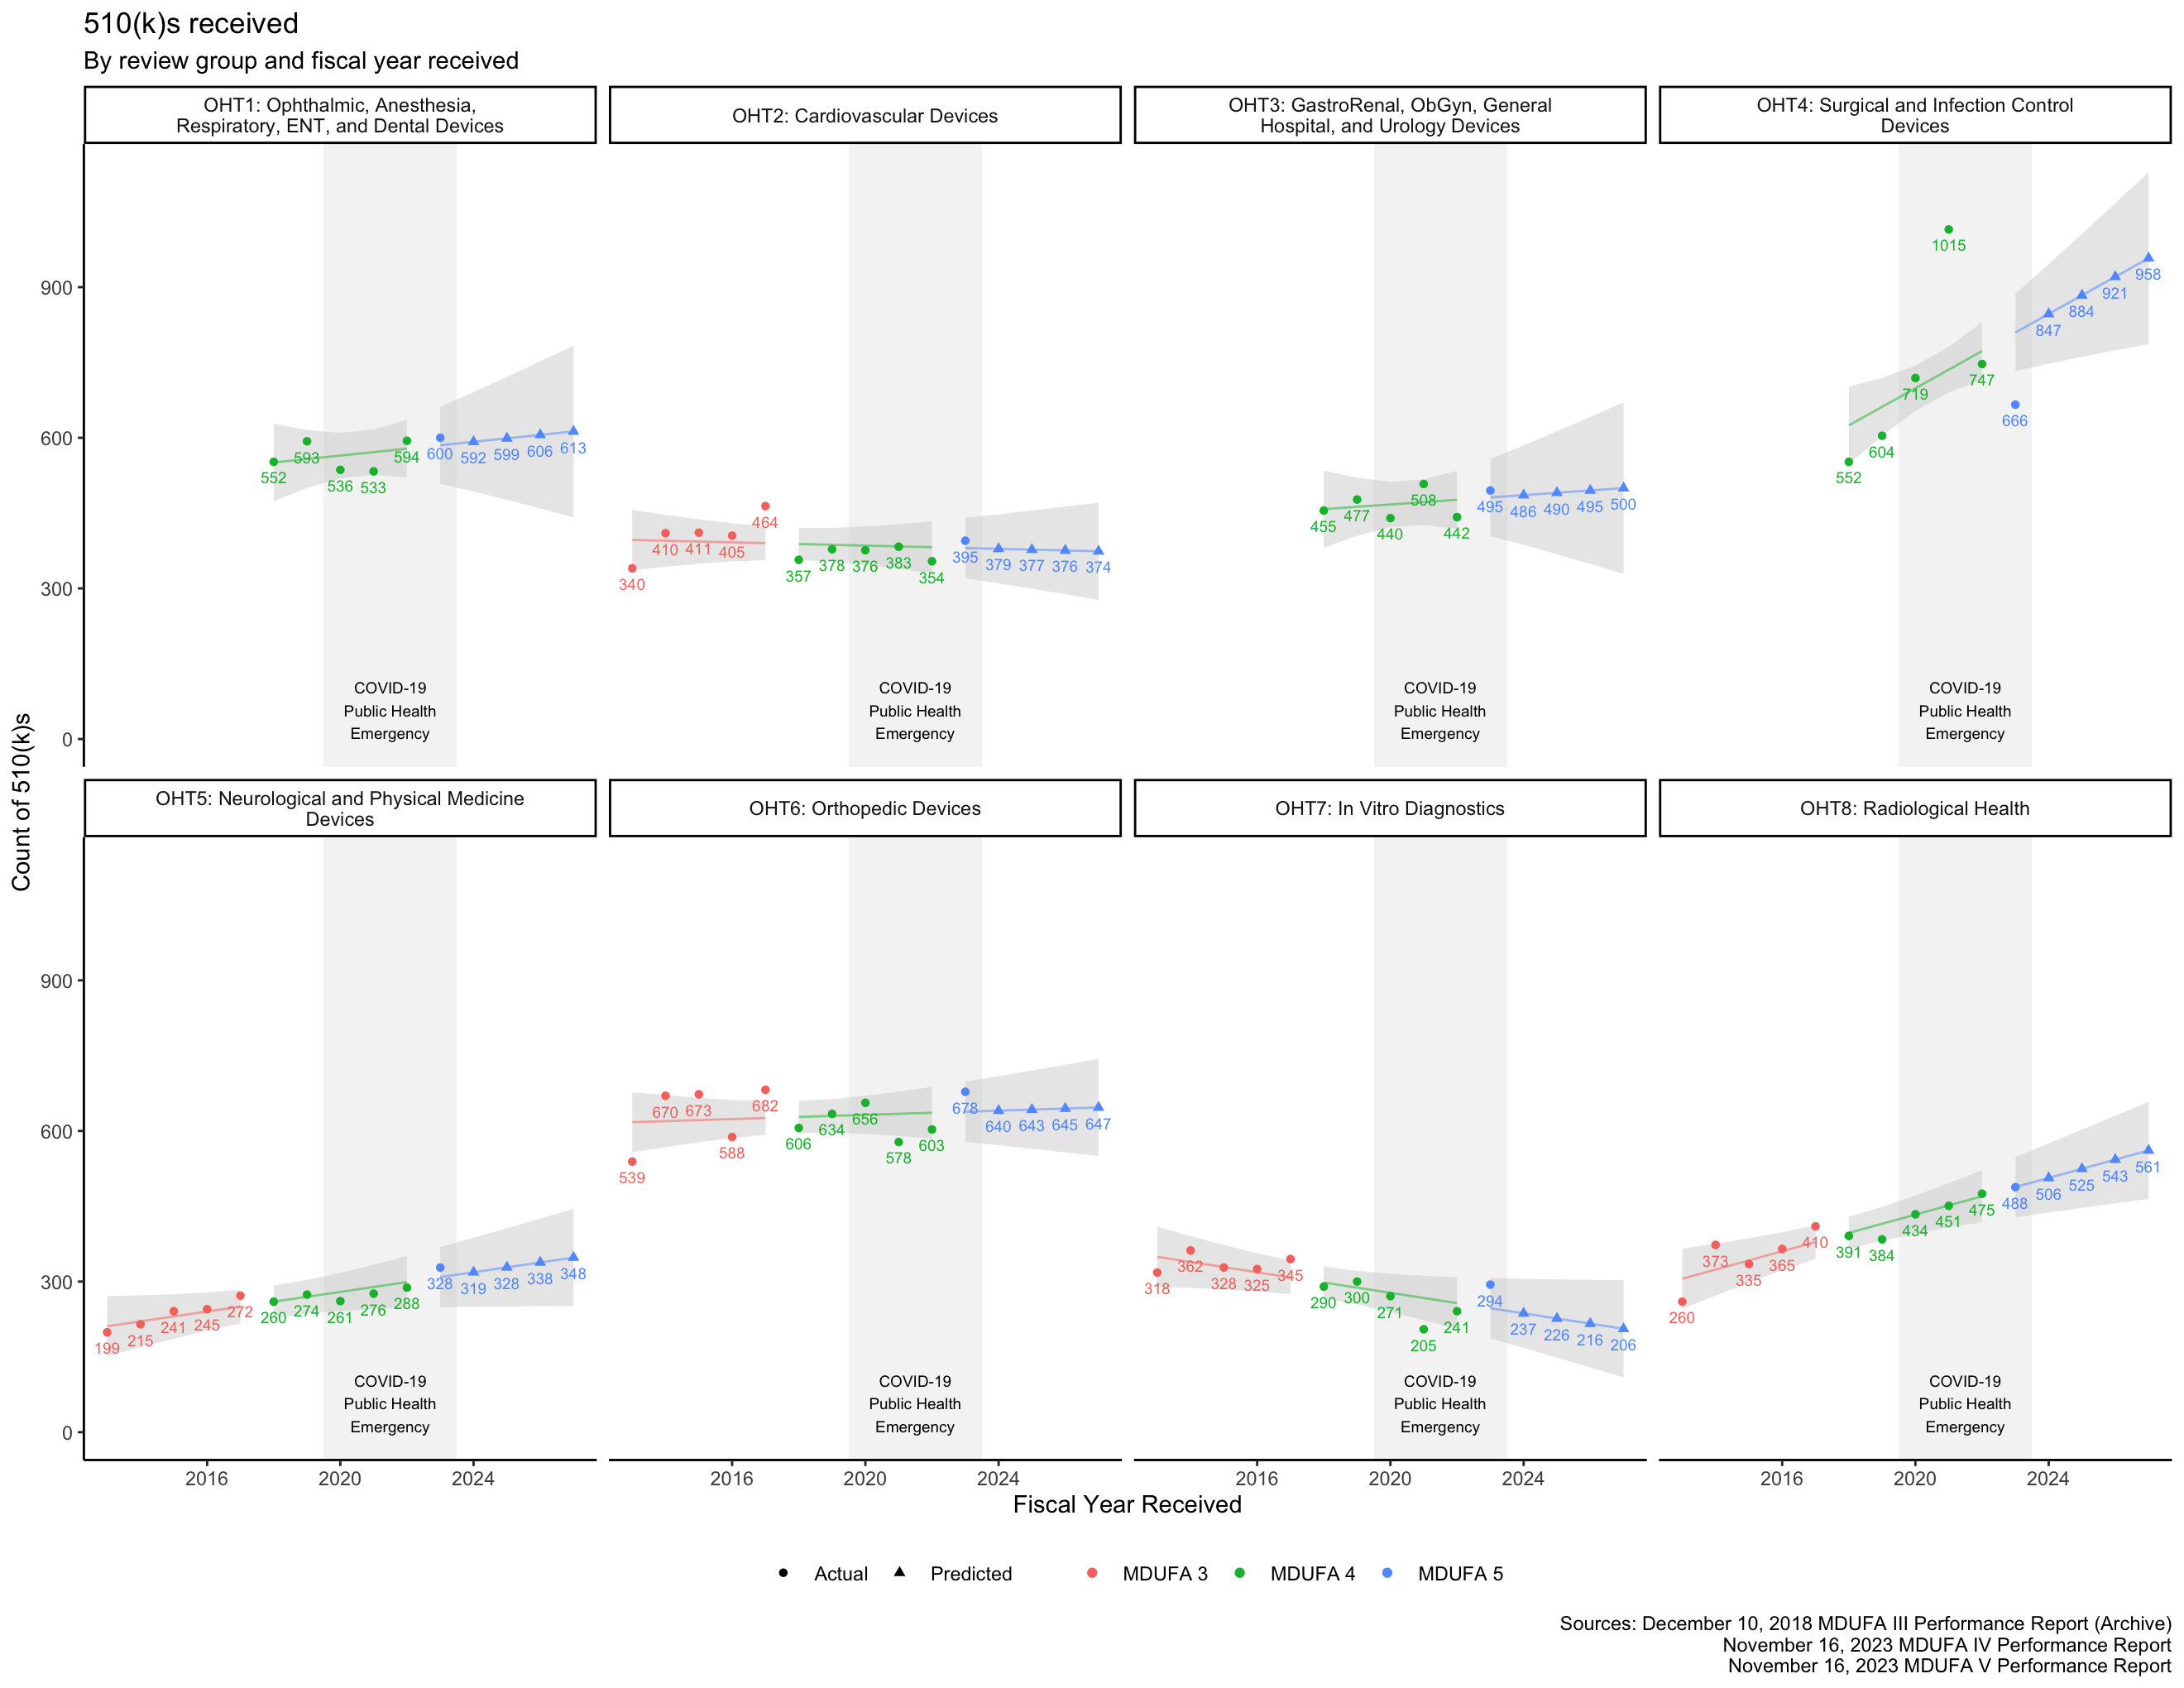
The MDUFA reports include information about submissions received over time. This can be plotted, and future submission volume can be projected. The projections provided here are somewhat naive: They are linear models based on fiscal year and review organization. This means that, for example, the OHT4 projections do not account for any impact that the end of the PHE may have on submission volume, and the OHT7 projections do not account for any impact that the FDA’s proposed rule on Laboratory Developed Tests or Procedures may have on submission volume.
Figure 1: 510(k) submission volume by OHT and fiscal year received as of the corresponding MDUFA report cutoff dates. Raw data.

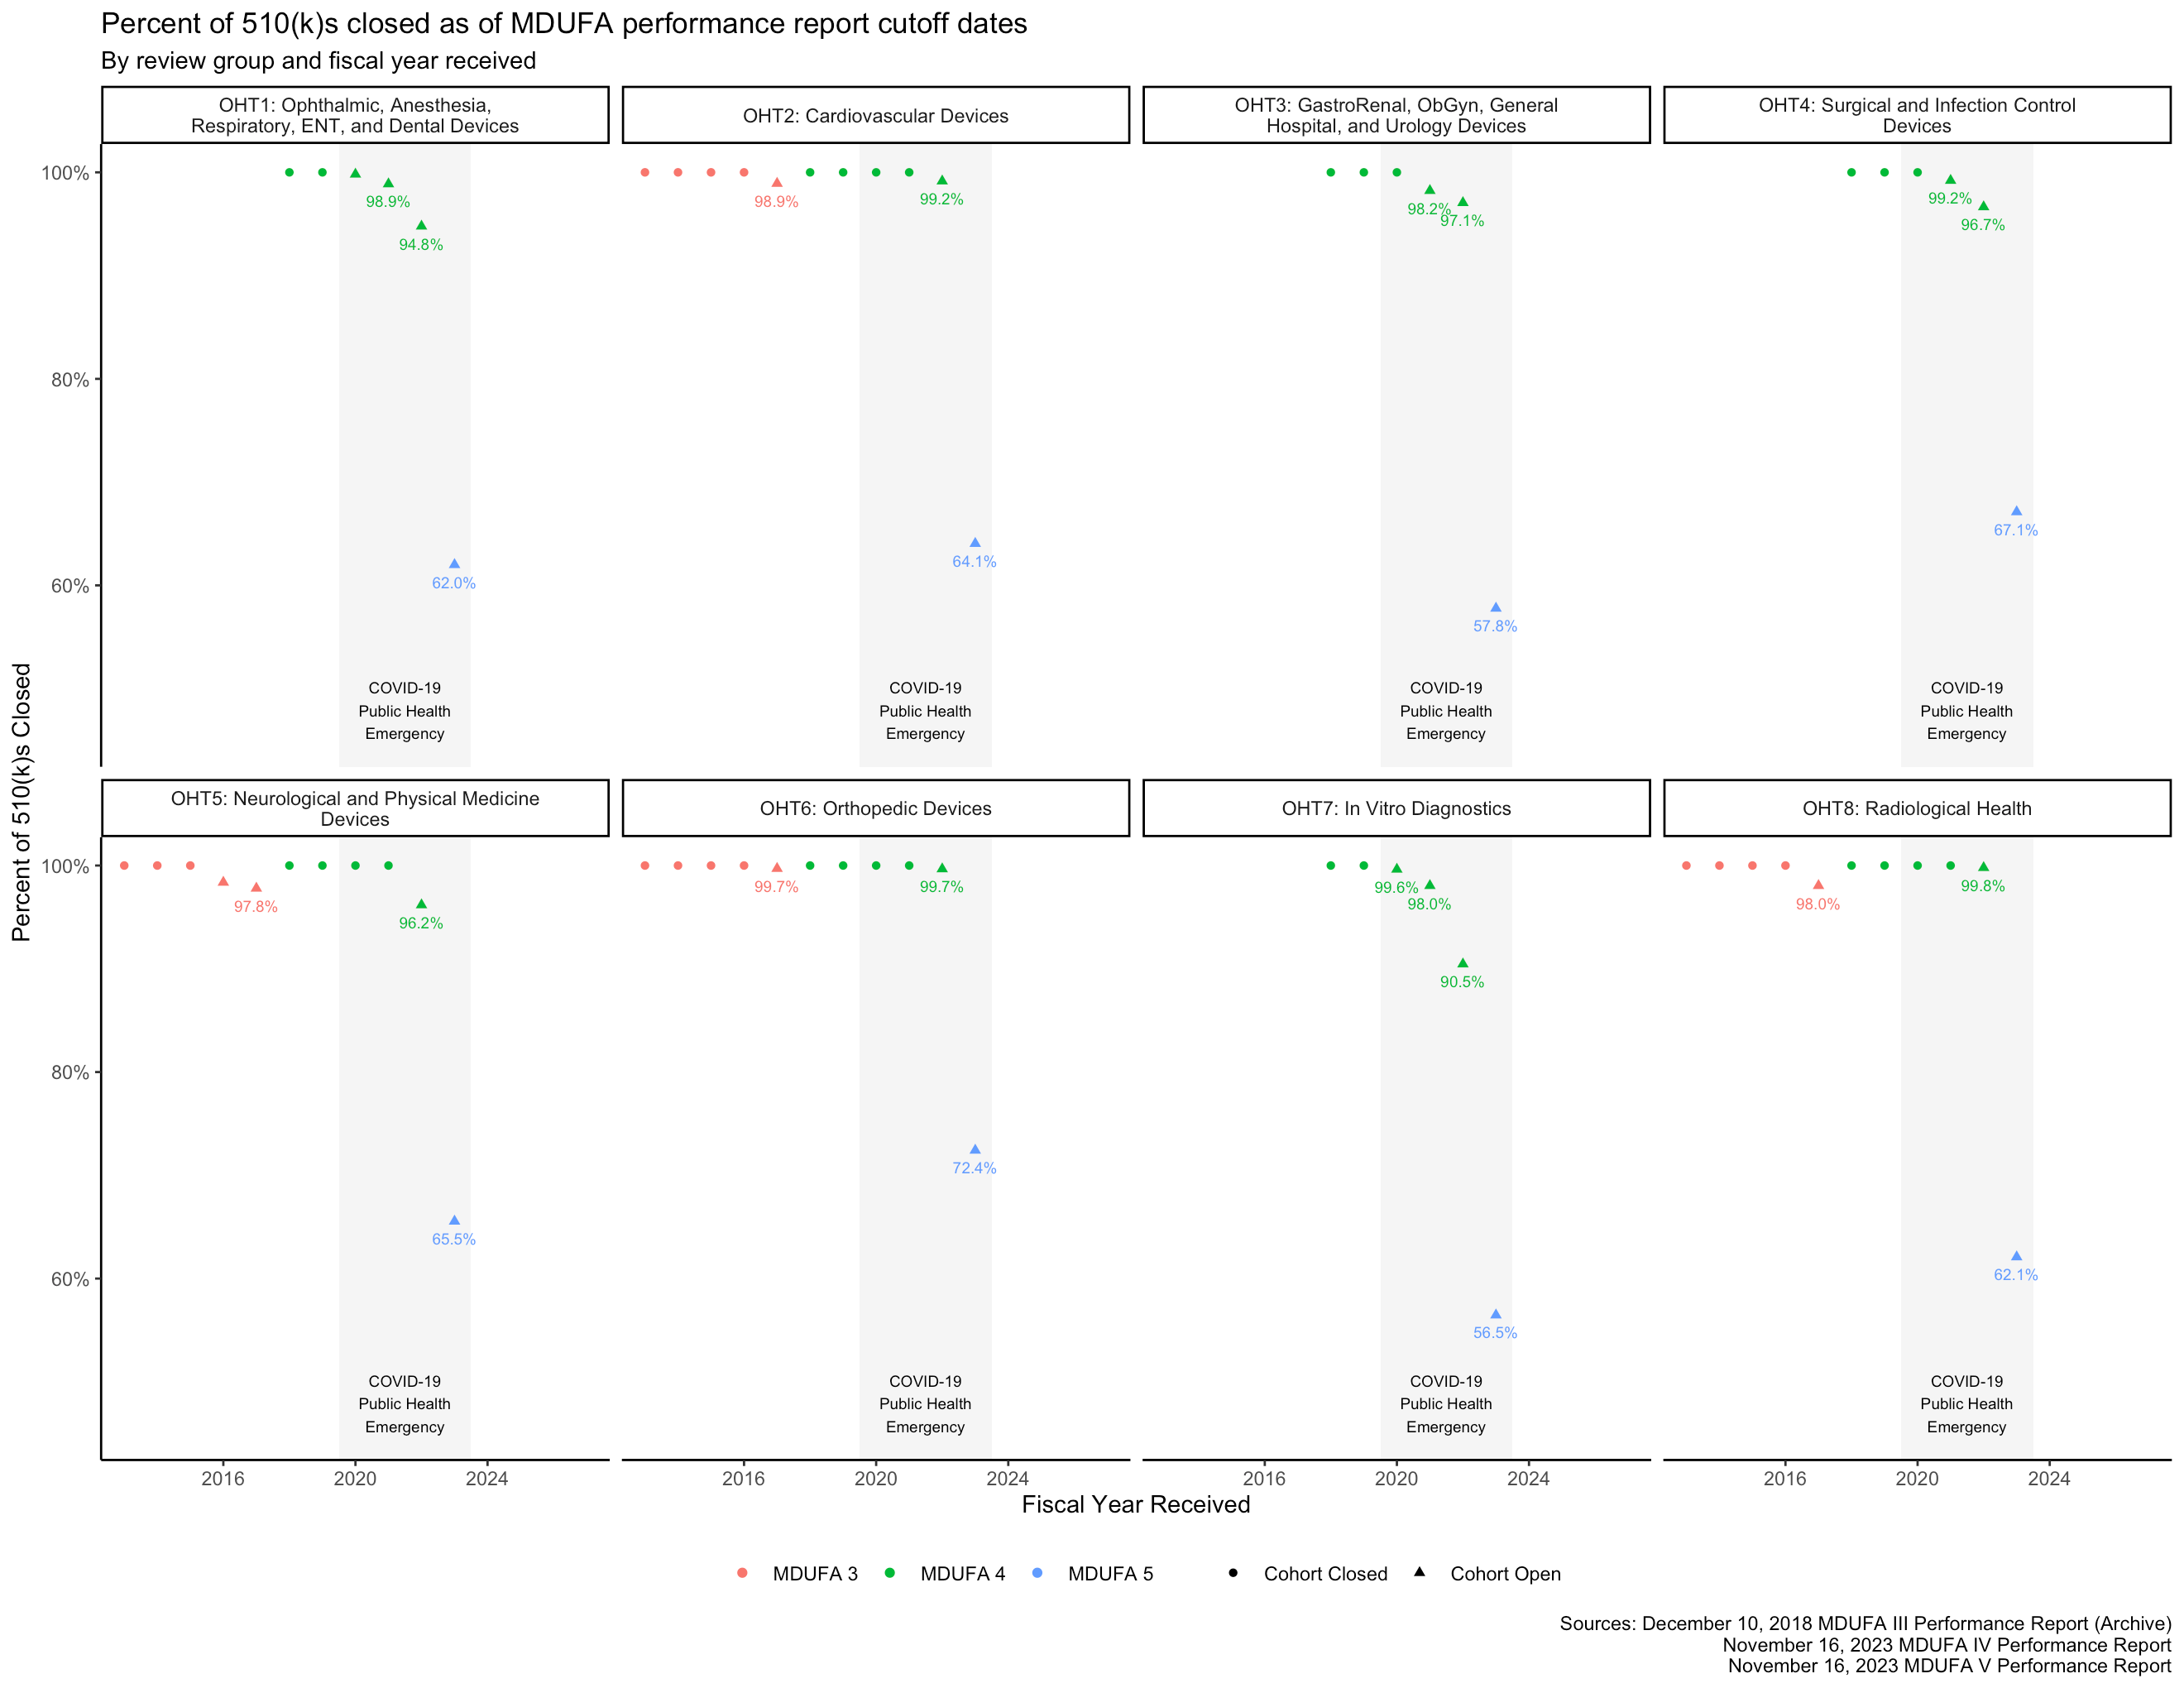
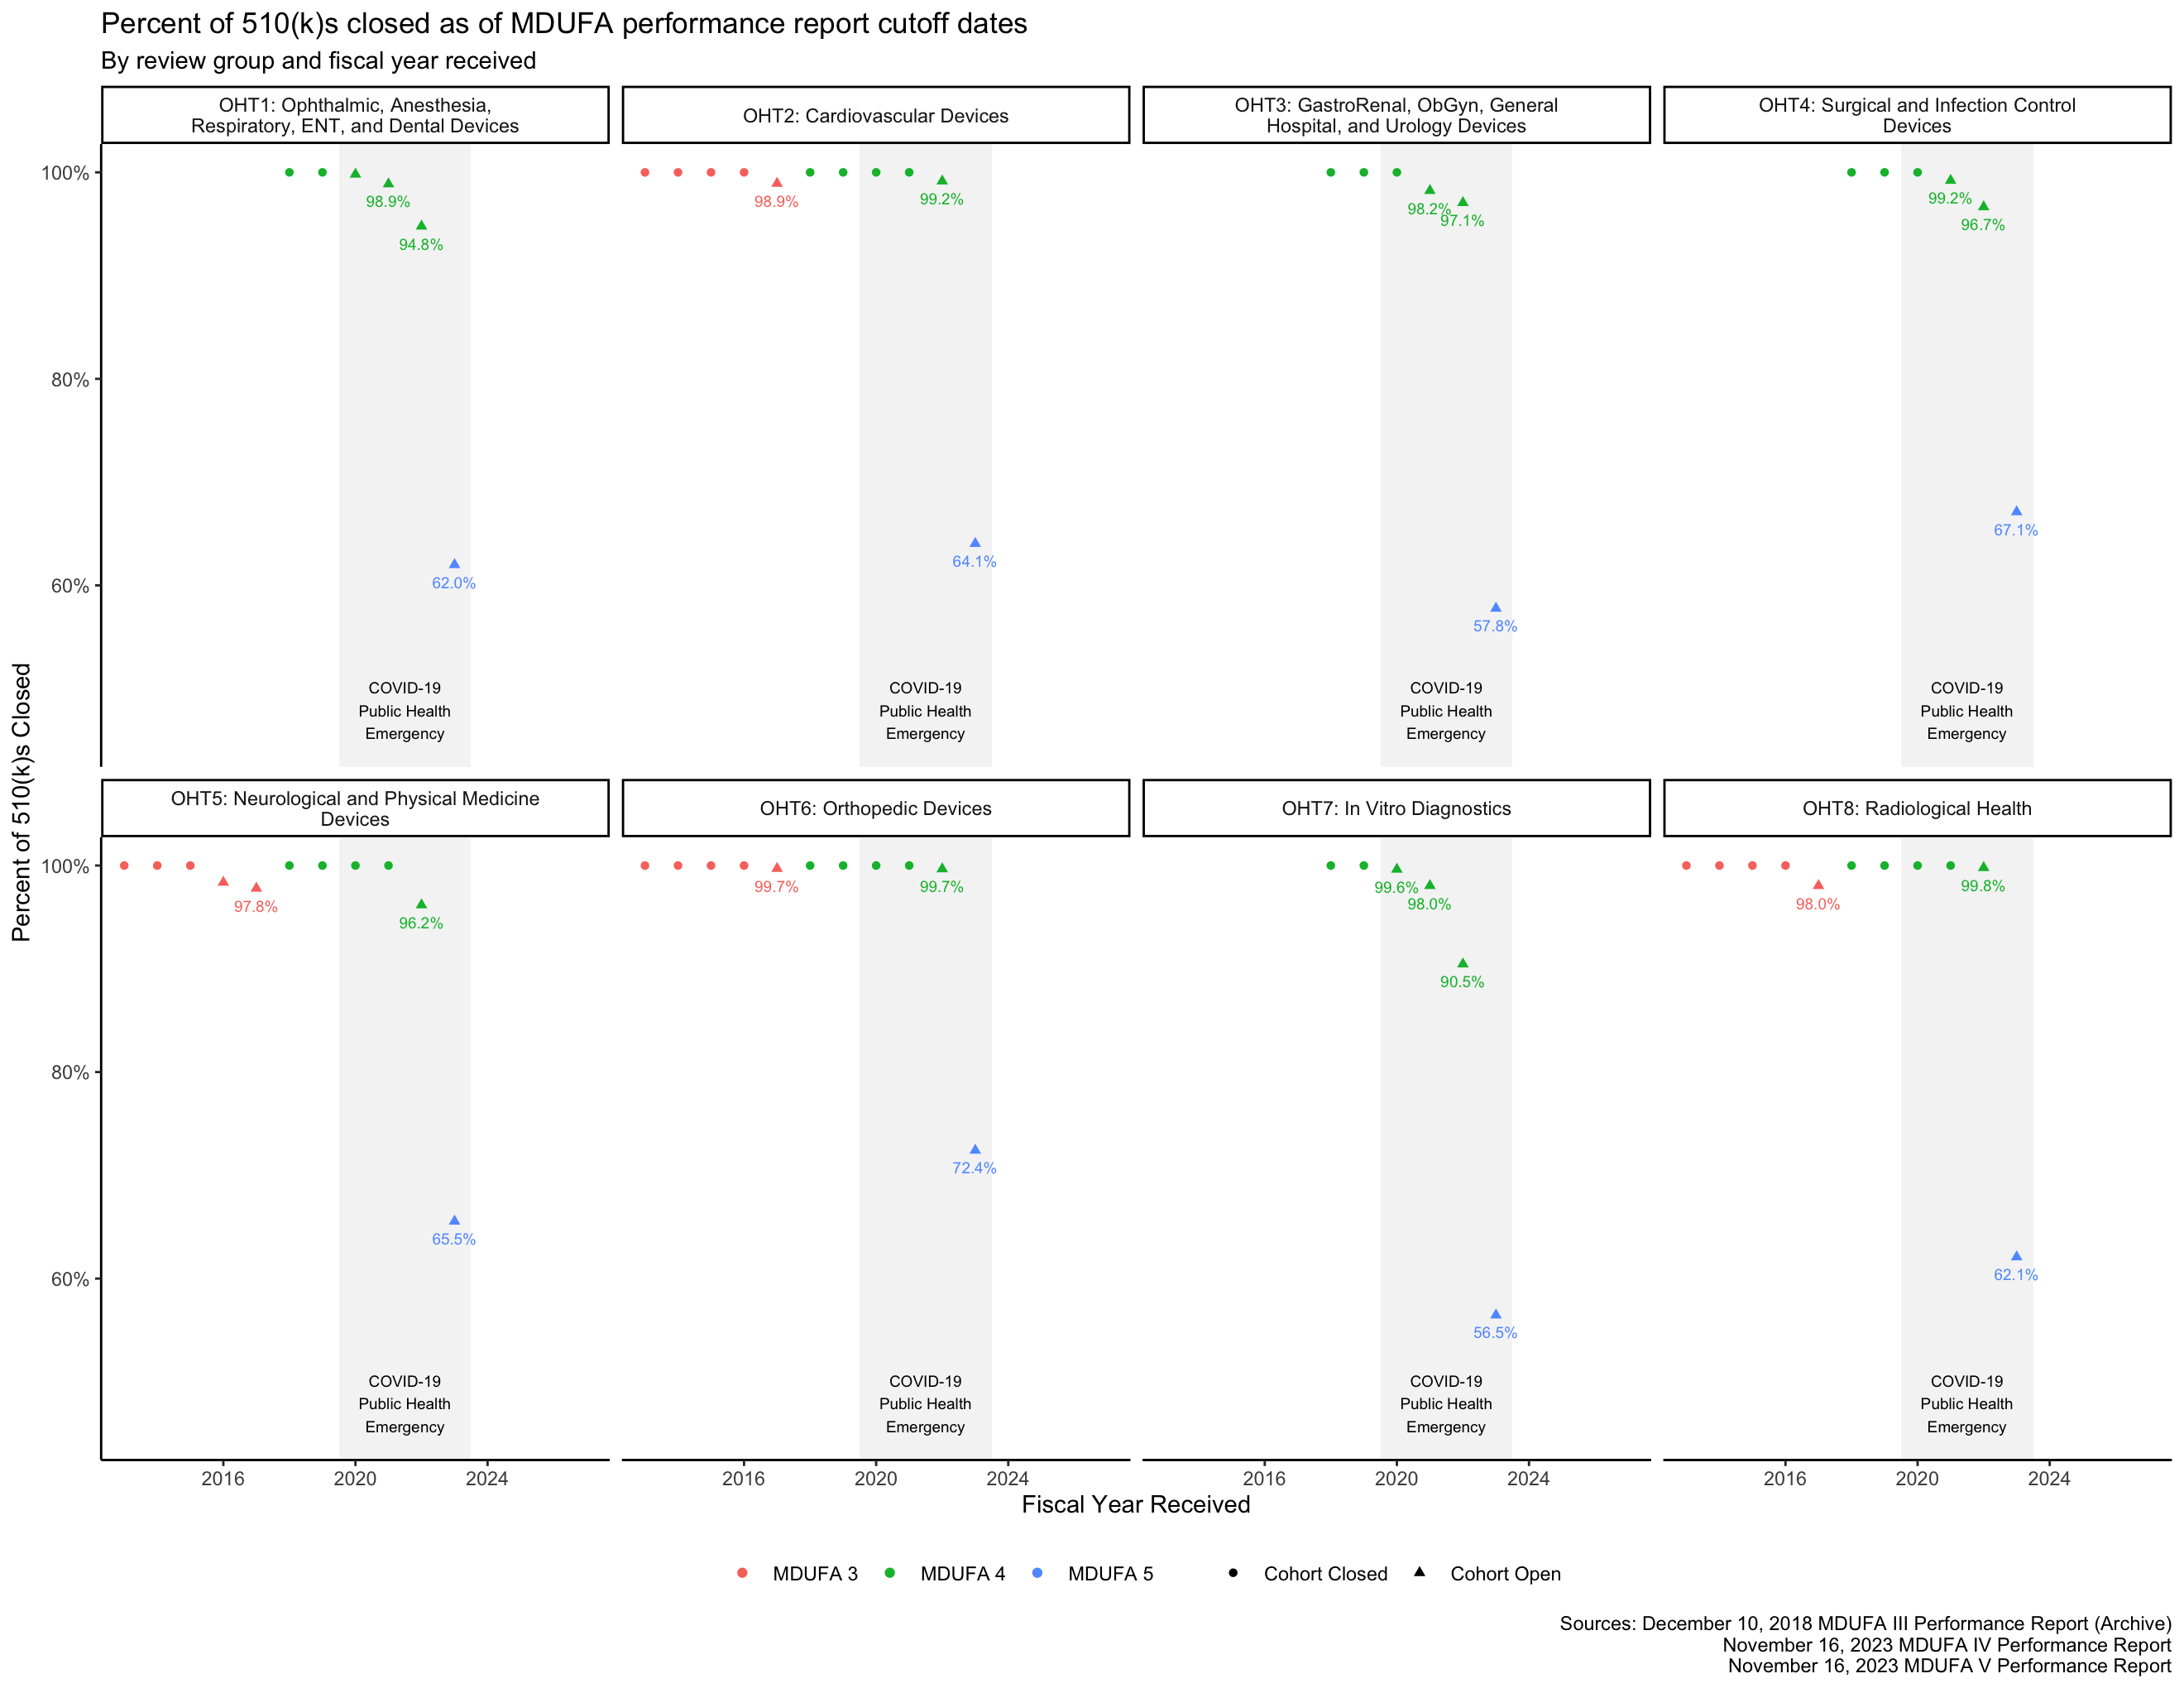
Cohort closure percentage
See this section above for a discussion of what it means for a receipt cohort to be open or closed. As expected, Figure 2 shows that the FY 2023 510(k) receipt cohort had many open 510(k)s as of the most recent MDUFA performance report, meaning that performance metrics calculated on that cohort and shown in the figures throughout this post are likely to change substantially in future reports.
Figure 2: 510(k) cohort closure percentage by OHT and fiscal year received as of the corresponding MDUFA report cutoff dates. Raw data.
O’Leary’s closing thoughts:
The objective of this work was to make the information in the MDUFA reports easier to access, analyze, and use. This post provides novel visualizations of about 1,500 values from the FDA’s 510(k) program metrics over time and across review groups. These visualizations are intended to provide a more useful view of the tabular data provided throughout the FDA’s MDUFA reports while still presenting that data dispassionately and with appropriate context.
Read the full report on his blog.
Also, be sure to check out his excellent work creating a database of extracted text from more than 72,000 FDA medical device 510(k) summaries. If you’re in search of a predicate or doing research yourself, it’s an incredible resource.
Read more about Brendan O’Leary on his website and follow him on LinkedIn. You can subscribe to his blog here.
Disclaimer and Attribution:
This article features content based on "Downloadable spreadsheets and graphs of the FDA’s medical device review performance metrics" by Brendan O’Leary, which can be accessed here. The original work by Brendan O’Leary is licensed under a Creative Commons Attribution 4.0 International License.
Summaries of the text have been adapted to fit the format and style of this newsletter. Any modifications or adaptations of the original content were made for clarity and conciseness and do not imply any endorsement by the original author.
It should be noted that the inclusion of Brendan O’Leary’s work in this article does not imply that the author endorses this publication or its contents.
This content is used in accordance with the Creative Commons Attribution 4.0 International License and is adapted for commercial use within this publication.
Who is The FDA Group?
The FDA Group helps life science organizations rapidly access the industry's best consultants, contractors, and candidates. Our resources assist in every stage of the product lifecycle, from clinical development to commercialization, with a focus on Quality Assurance, Regulatory Affairs, and Clinical Operations.
With over 2,500 resources worldwide, over 225 of whom are former FDA, we meet your precise resourcing needs through a fast, convenient talent selection process supported by a Total Quality Guarantee.