

Inside FDA’s 2024 Quality Report: What RA/QA Teams Need to Know
Foreign inspections surge, warning letters hit a five-year high, and API supply chains face mounting risk—what the FDA’s latest pharma quality report means for your compliance strategy.


Only paid subscribers get regular full access to our breakdowns and other analyses. If you’re not already a paid subscriber, you can upgrade here.
The FDA's Office of Pharmaceutical Quality (OPQ) has released its seventh annual Report on the State of Pharmaceutical Quality for fiscal year 2024, offering a ton of trend data and analysis into drug manufacturing oversight and compliance.
The new report, spanning October 2023 through September 2024, reveals a few big shifts in regulatory enforcement patterns and emerging quality challenges that demand immediate attention from industry quality and regulatory affairs teams.
The big picture: FY2024 saw increases in inspections (especially foreign), a rise in warning letters, and improvements in biosimilar approvals and product catalog growth. Quality remained generally strong (93% compliance), but risks concentrated in API suppliers for compounding pharmacies, OTC manufacturers, and ophthalmic products.
We’ve pulled out the key takeaways and a few lessons in light of them.
The notable stats at a glance
Here’s a quick distillation of the most notable data points extracted from the report, organized by category:
Manufacturing sites and inspections:
Total sites in CDER’s Site Catalog: 4,619 (41% U.S., 59% foreign).
Inspections conducted (FY2024): 989, up 27% from FY2023 (776).
Foreign vs. Domestic inspections: Over 62% were foreign (all-time high).
MRA partner inspections: 198, the highest number to date.
Compliance outcomes: 93% of sites globally had No Action Indicated (NAI) or Voluntary Action Indicated (VAI) on the most recent inspection. Highest compliance: Europe (98%), Lowest: India (87%).
Drug product demographics
Total products in CDER catalog (end FY2024):
14,168 ANDAs (+4.4% vs. FY2023)
3,625 NDAs (+0.9%)
383 BLAs (+8.2%), including 63 biosimilars (+47% vs. FY2023)
140,119 non-application product NDCs (+6.7%).
Overall product growth: +6.3% in FY2024 (similar to FY2023 +6.1%).
Postmarket Quality Defects (PQDs)
Total reports: 16,837 (↓1.5% vs. FY2023).
MedWatch reports: 12,588 (+0.3%).
Field Alert Reports (FARs): 3,515 (↓7.5%).
Biological Product Deviation Reports (BPDRs): 409 (+17%).
Consumer complaints: 325 (↓18.3%)
Import Alerts, recalls and warning letters
Import alerts:
75 sites added to import alerts (FY2024).
Majority: OTC monograph drug sites (65%).
25% were API manufacturers (up from 2% in FY2023).
Largest shares: China (39%), India (13%), Europe (13%).
Recalls:
421 recalled products (lowest in five years).
165 sites generated 260 recall events (↑15% vs. FY2023).
Most common defect: Contamination (31% microbial, 28% sterility issues, 20% particulates).
Top recall categories (by USP Drug Classification): Ophthalmic agents (14.1%), Antibacterials, Cardiovascular, Dermatological, Respiratory, Analgesics.
Geography: U.S. (48% of recalls), India (41%).
Warning letters:
105 total issued (highest in 5 years).
U.S.: 41 (↓ from 59 in FY2023).
Foreign: Increased, especially China (13) and South Korea (9).
Drivers: More inspection-based letters (+21% vs. FY2023).
High-risk API suppliers: 72% of actions against API sites were for those supplying compounding pharmacies (only 18% of API sites overall).
Inspections surged back after the pandemic
Maybe the most striking development is the dramatic acceleration of the FDA's inspection activities.
The agency conducted 989 drug quality assurance inspections in FY2024—a 27% increase from FY2023's 776 inspections.
More notably, foreign inspections reached an all-time high, comprising 62% of all quality assurance inspections.
"In FY2024, more than 62% of drug quality assurance inspections were at foreign sites—an all-time high," the report states, with particular emphasis on India and China, where 34% and 28% of sites in the Site Catalog, respectively, underwent inspection.
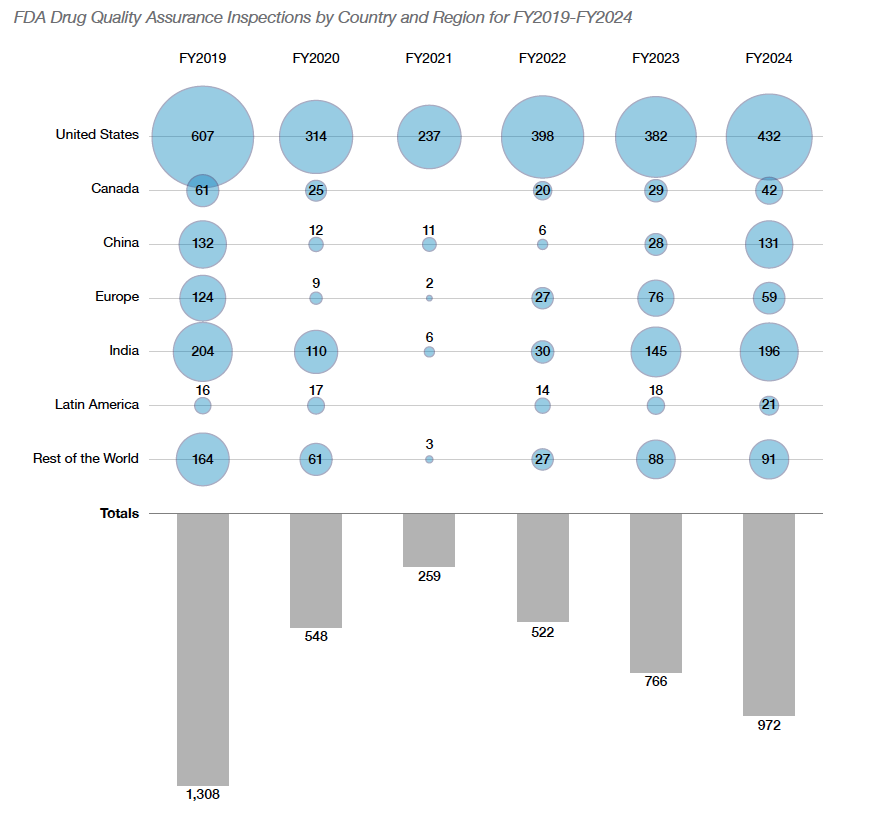
The report also reveals that the FDA achieved its highest-ever number of Mutual Recognition Agreement (MRA) partner inspections at 198, demonstrating the agency's growing reliance on international regulatory partnerships to extend its oversight capabilities.
Warning letters hit 5-year high
More inspection activity has translated directly into enforcement actions—something we’ve seen firsthand as an auditing, mock inspection, and remediation partner for much of the industry.
The FDA issued 105 warning letters for drug quality issues in FY2024—the highest total in five years. Domestic warning letters decreased from 59 to 41, while foreign warning letters increased from 35 to 64.
Much of the overall rise was inspection-driven, though Chinese sites were an exception, with most of their letters stemming from deficiencies in §704(a)(4) records requests rather than inspections.
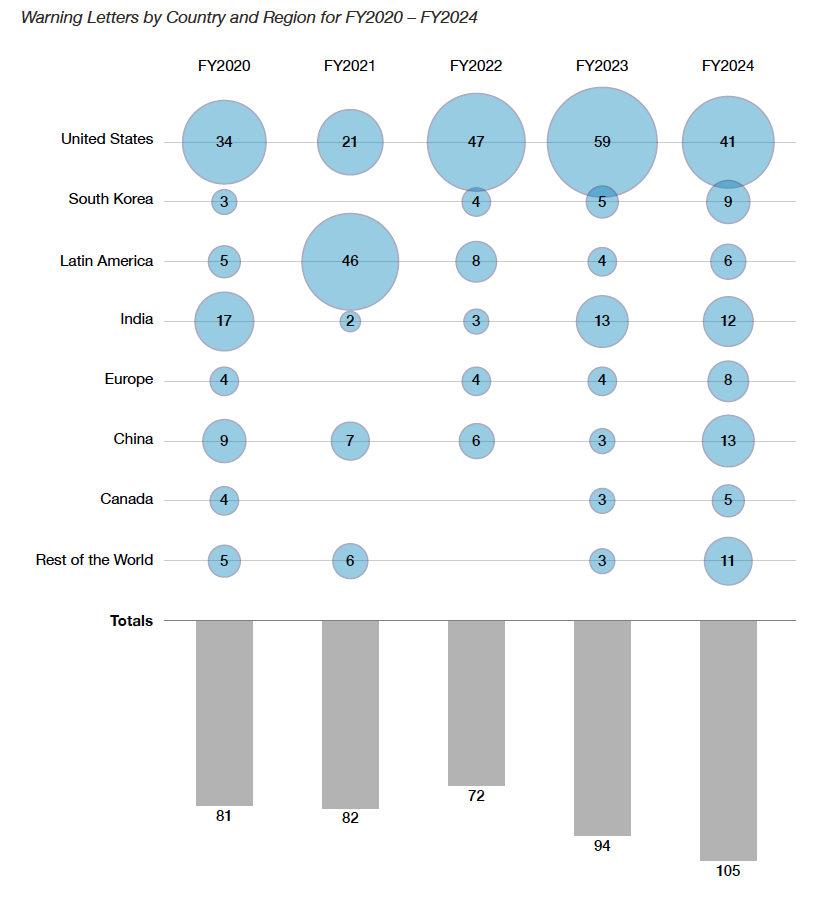
China received particular scrutiny, with warning letters to Chinese sites primarily stemming from deficiencies identified through Section 704(a)(4) records requests rather than traditional inspections.
From the report:
"Unlike the overall increase in warning letters that was inspection-based, the increased number of FY2024 warning letters issued to sites in China was primarily due to quality deficiencies identified in §704(a)(4) records requests (8 of the 13 warning letters)."
Compounders are having an API supply chain crisis
One of the report's most alarming findings concerns Active Pharmaceutical Ingredient (API) manufacturers supplying domestic compounding pharmacies.
The data reveals a stark quality disparity:
"Over the past five years, 72% of API manufacturing sites subject to FDA regulatory actions (e.g., warning letters, import alerts, and regulatory meetings) were sites that exclusively supply compounding pharmacies," despite these sites representing only 18% of API manufacturers in the Site Catalog.
This four-fold overrepresentation in regulatory actions suggests systemic quality issues within this subset of the supply chain, with violative sites predominantly located in China (51%) and India (30%).
Anecdotally, this lines up precisely with what we’ve seen over the past ~12 months, too: a notable increase in compounding pharmacies engaging either proactively for QMS support, auditing, and inspection readiness—or reactively after getting inspectional observations via a 483, warning letter, or other enforcement mechanism.
Read more on this issue here and here.
If you’re in the compounding world or know someone who needs RA/QA support, get in touch with us. We have the unicorn compounding talent that’s been hard at work closing these gaps across the industry.
Import alert patterns highlight an expanded surveillance approach
The report documents 75 sites added to import alerts for quality reasons in FY2024, with China accounting for a disproportionate 39% despite representing only 17% of foreign sites.
Significantly, 65% of quality-related import alerts targeted manufacturers of OTC monograph drug products, while 25% involved API manufacturers.
The FDA made broad use of Section 704(a)(4) records requests in FY2024, with more than 60% of quality-related import alert additions tied to this tool. Notably, 40% of import alerts were issued to sites the FDA had never inspected, reflecting a wider net for oversight rather than a wholesale shift away from inspections.
Drug amount reporting shows improvement but gaps remain
Following the implementation of CARES Act requirements, drug amount reporting has improved markedly for application products (BLAs at 71%, NDAs at 65%, and ANDAs at 60% for CY2024).
However, OTC monograph products lag significantly at just 37% reporting compliance.
"Despite incomplete drug amount reporting, FDA leveraged the available submitted data to inform the FY2025 Site Selection Model for surveillance inspections," the report notes, signaling that non-compliance may increasingly influence inspection targeting.
Recalls hit a 5-year low in terms of products, despite more events
Sort of paradoxically, while the total number of recall events actually increased 15% over FY2023 (260 events), the number of recalled products (421) was the lowest in five years.
